The media are misleading the public. And we can prove it.
Democrats would seize control of the Wisconsin Legislature under almost all of the redistricting maps submitted to the liberal-controlled state Supreme Court.
8 of the 10 Democratic-leaning maps submitted to the Court would flip control to Democrats using a composite of election data from 2016 to 2022. That includes Gov. Tony Evers’ maps, which he submitted with assistance from AG Josh Kaul.
10 of the 10 Democratic-leaning maps flip control to the Democrats if you use only the 2022 governor’s race instead to determine the electorate’s partisan makeup.
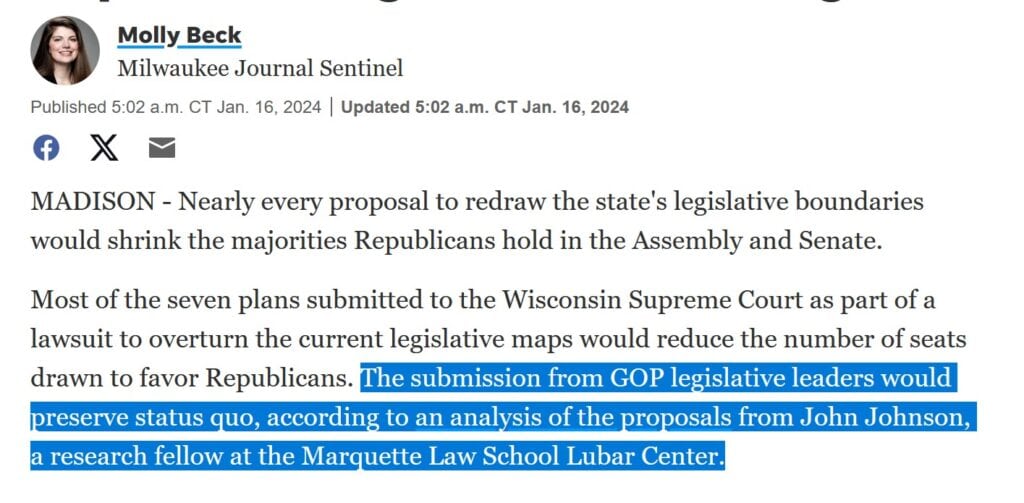
Yet the media, including the Associated Press, have misled Wisconsin voters into believing that most of the maps keep Republicans in control. Example:

This is misleading. Bauer’s article, which was republished all over the state, is based on a single, obscure university research fellow’s unique and arguably problematic theoretical statistical model. Much of the media followed suit. Instead, we conducted our analysis using the widely-used, respected redistricting software, Dave’s Redistricting, which provides hard election data.
It shows the opposite result: Democrats flip control of the Legislature. This contradicts Democrat Evers’ dishonest rhetoric that the maps are “fair” and non-partisan, left largely unchallenged in the Wisconsin media.
Consider what happens to the Legislature when you use a composite of all election data from 2016 to 2022 to determine the electorate’s partisan makeup. Under Evers’ maps:
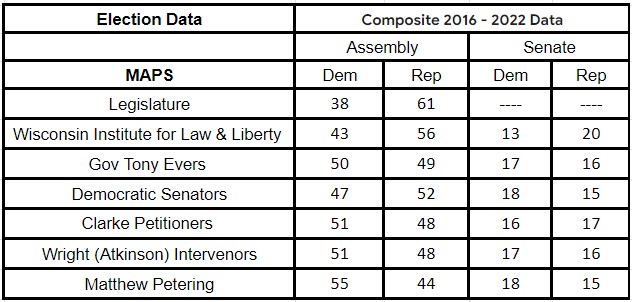
Democrats would control the state Assembly 50-49.
Democrats would control the state Senate 17-16.
Democrats also seize control of the state Legislature in the majority of maps when you use the 2022 governor’s race to determine districts’ partisan lean. Under Evers’ map:
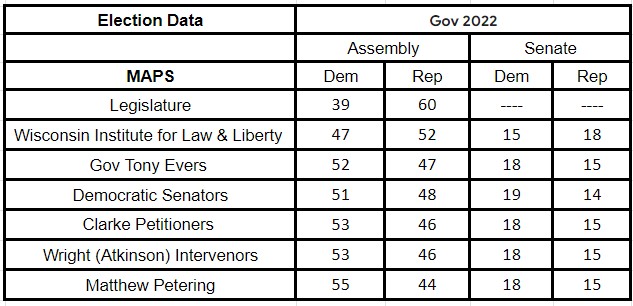
Democrats would control the state Assembly 52-47.
Democrats would control the state Senate 18-15.
The Legislature is currently in Republican control, 22-11 in the state Senate, and 64-35 in the Assembly.
How Did We Conduct Our Analysis?
Wisconsin Right Now used Dave’s Redistricting Mapping software to analyze the proposed maps. Dave’s Redistricting Application is sophisticated mapping software that allows you to calculate the proposed partisan lean for each district based on each map. It’s a commonly used and respected redistricting tool.

Seven groups submitted maps; six submitted two (for the Senate and Assembly). The Legislature submitted an Assembly map.
What the media are failing to tell readers: The partisan totals change depending on which election data you use to determine partisan shift.
Here are the results for each of the 13 submitted maps using a composite of Wisconsin election data from the following elections: President 2016, President 2020, Senator 2018, Senator 2022, Governor 2022, and Attorney General 2022.

Here we used only the data from the Wisconsin 2022 gubernatorial election, which is the most recent statewide partisan election:

Only the state Legislature’s map and the map submitted by the Wisconsin Institute for Law and Liberty keep Republicans in control.
As a side note, Petering’s maps have now been removed from consideration.
The media’s reporting was based on a different statistical model created by John Johnson, a research fellow at Marquette University.
We asked Johnson if he agreed that Dave’s Redistricting software shows the majority of maps flipping control of the Legislature to the Democrats based on the 2022 governor’s race.
“I agree with that calculation from DRA (Dave’s Redistricting),” he said, confirming our results.
It’s even worse when you dig into the particulars.
All over the state, Evers’ maps rig the game even more for Democrats by shoving Republican incumbents into new districts to remove the power of incumbency; pit dozens of Republicans against other Republicans in new districts; peel away conservative areas from swing districts; and even switch legislators to different numbered districts so some can’t run for re-election for two years, essentially forcing them out of the Legislature.
Furthermore, Evers’ map contains seven swing districts that Democrats could also win.
Two out-of-state consultants chosen by the liberals on the state Supreme Court have until Feb. 1 to review the submitted maps and make recommendations to the court. The court will choose new maps by March 1, even though the state Constitution gives authority to redistrict to the Legislature. The consultants do not have to choose any of the submitted maps, but they can.
The same result is generated using the results of the 2022 attorney general’s race. That Republican, DA Eric Toney, ran stronger than the Republican candidate for governor. Evers’ map shows the Democrats would still flip control of the state Legislature under that barometer, too.
Democrats would control the Senate 17-16. But that’s not the complete story.
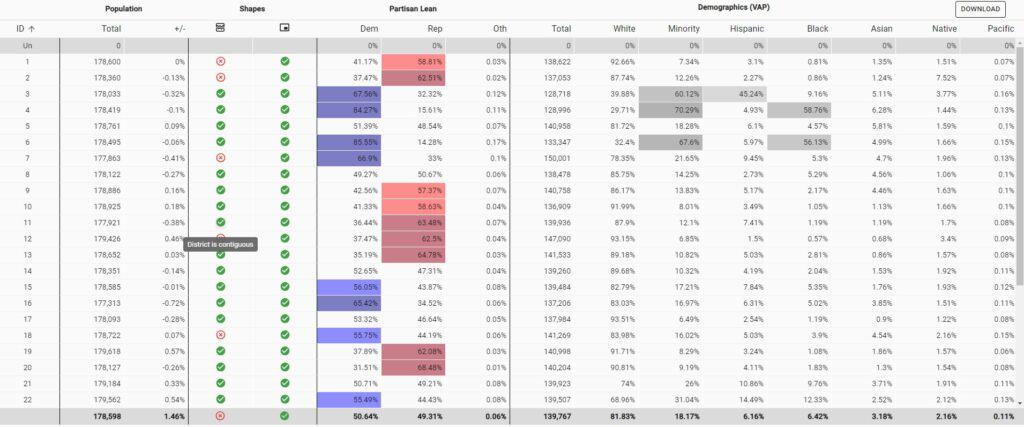
For example, one of the Senate seats in the Evers’ map that comes up as Republican-controlled is the 8th Senate seat in the Milwaukee metropolitan area. But it’s exceptionally close, 50.67% Republican to 49.27% Democratic lean.

Now consider what Evers’ map does to that state Senate seat. He has redrawn it to pit the Republican incumbent, Dan Knodl, against another popular Republican incumbent, Duey Stroebel. Evers has redrawn it to split the more conservative areas out of the district (Republican Knodl won the race in a special election in 2023 by a very narrow margin.)
Similarly, using the AG results, Democrats flip the Assembly to 50-49. But what is the closest swing district? District 85. It’s 50.03% Republican and 49.93% Democrat.
So guess what Evers did? He removed a popular Republican incumbent, Pat Snyder, from the newly drawn 85th district, which is in Wausau (putting Snyder in a neighboring district by just a few blocks.) He also split Schofield, even though it’s a community of just 2,100 people, and municipal boundaries are supposed to remain intact. Through this example, you can see how Evers is gaming it so the partisan divide is even more favorable to Democrats than the numbers appear at first glance.
“They (Democrats) couldn’t beat me in four tries here,” Snyder said. “I just can’t believe they cut into Schofield and drew me out. They can’t win by policy. They have to win by rearranging things to gain power.”
How the Media Are Misleading the Public
The Wisconsin media have painted a very different and misleading story, essentially adopting the spin of Democrats.
Let’s look at some of the media’s reporting.
Wisconsin Public Radio reported: “If the 2022 election was held using new legislative voting maps proposed by parties to a state redistricting lawsuit, Republican lawmakers would be projected to maintain legislative majorities in almost every option.”

An Associated Press story read, “Most of the newly ordered maps redrawing Wisconsin’s political boundaries for the state Legislature would keep Republicans in majority control, but their dominance would be reduced, according to an independent analysis of the plans.” That story was replicated all over the state and country, even ending up on CBS News.
The news outlets are basing their findings on Marquette University research fellow John Johnson’s analysis. Indeed, Johnson’s analysis, written on a faculty blog, appears to be driving many of the news headlines.
In other words, the media are relying on a single research fellow rather than doing their own analysis of the maps or using Dave’s Redistricting, the common tool.
Johnson’s curriculum vitae (resume) says he has been a research fellow at Marquette since 2018. Before that, he was a research associate, starting in 2016. His previous experience prior to 2016 was as a teaching assistant. He has a master’s degree from the University of Illinois. His CV indicates he does not have a Ph.D. He lists six publications, all but one on a faculty blog. None has to do with elections.
Let’s take a closer look at what Johnson did.
Johnson acknowledges in his blog post that he came up with the results using a statistical model he created, showing Republicans retaining legislative control in most maps.
The AP told readers only that Johnson developed his results by “using a statistical model.” We asked Johnson to explain.
The problem isn’t that the media are telling people about Johnson’s model; it’s that they aren’t explaining that it’s just one model. They aren’t explaining that the commonly used software – Dave’s Redistricting – comes to a different result using recent election data.
“I am not trying to predict future election results,” Johnson explained to WRN in an email. “Rather, my model is an effort to understand how the 2022 election would’ve shaken out under these maps. Future elections will be different.”
We asked him to explain his model
“My model predicts the results of the 2022 state legislative races if they had occurred in these proposed remedial maps,” he said.
He said that he used a “linear regression model” that uses “the results from the races for governor, US senate, state treasurer, and attorney general to predict state legislative results.”
Johnson further explained, “We built the model using the seats that were contested. Then we apply the model to the new seats under the proposed alternative districts.” He notes, “You can read a more detailed discussion of the methodology here. The actual source code is here.”
Johnson acknowledges that his model includes an assumption that local Republican candidates will perform better than statewide ones. Theoretical models are only as good as the assumptions used to create them.
He believes that Republican legislative candidates “tend to do substantially better than statewide Republican candidates. That’s why my model finds that Republicans probably would’ve kept a slim majority in the 2022 election, had that election been held under one of the maps proposed by Democratic/liberal petitioners.”
However, we noted that Johnson did “not consider other factors, like incumbents being pitted against each other or moved to new districts stripping the power of incumbency from them. You acknowledge this could play a role in determining the final outcome of the Legislative control, right?”
“That is correct,” he responded. “My first analysis focused only on criteria listed by the WI Supreme Court’s opinion. Incumbency is an important factor.”
Either way, it’s irresponsible of the media to only inform the public about one guy’s unique model in such an important debate, when there are other credible tools that show an opposite result.
Table of Contents


