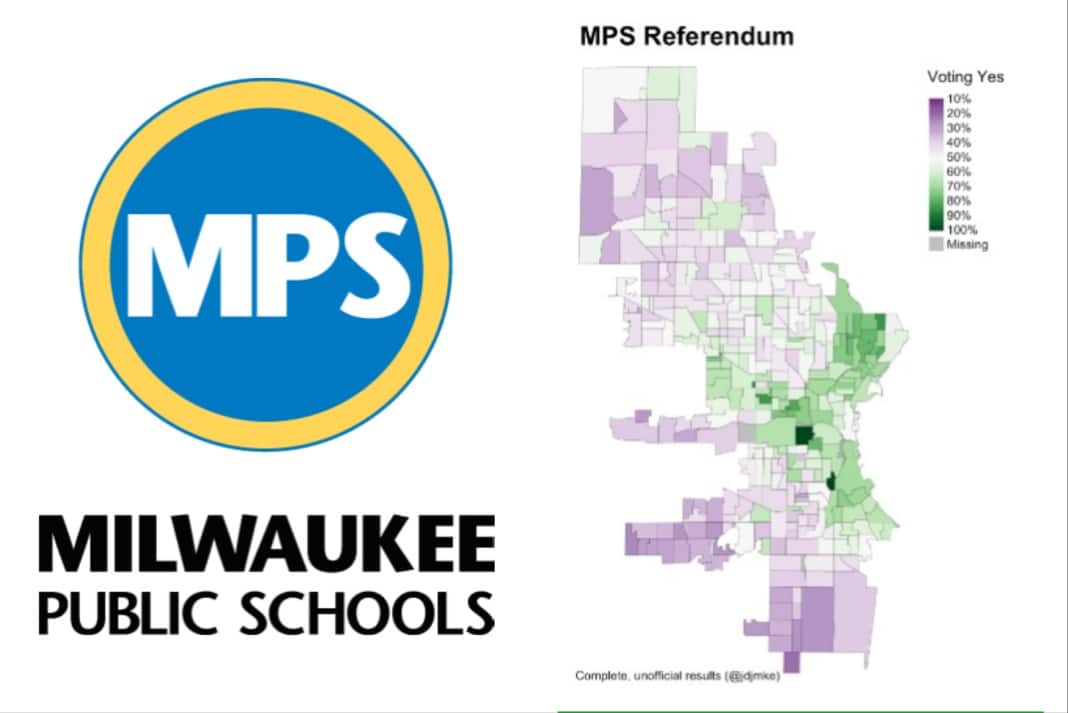
The massive $252 million MPS referendum won only in “majority white wards” and wards with few children, according to an analysis conducted by Marquette University research fellow John D. Johnson. A clear racial divide emerged, with the referendum failing in majority Black and Latino wards, Johnson found.
“Most north and northwest side wards also voted against the referendum,” he added.
The MPS referendum tax increase will be carried, in part, on the backs of some of the state’s poorest residents, many of whom did not support it. The racial disparity was documented in a detailed analysis conducted by Johnson, who was widely quoted in the media for his previous redistricting analysis.
“Owners of an average home in Milwaukee, which is around $200,000, will see an extra $432 on their property tax bills,” WISN reported. That comes on top of a recently approved massive new sales tax hike.
“Support for the referendum correlates somewhat w/race. It won majority white wards & lost the rest. But it correlates MUCH more with kids,” Johnson wrote in an analysis of the referendum, which passed by only 1,720 votes – 41,586 to 39,866.
He mapped the results:
Here's my look at some of the MKE county election results from last night. The MPS referendum is interesting.
Support for the referendum correlates somewhat w/race. It won majority white wards & lost the rest. But it correlates MUCH more with kids.https://t.co/2Jqev2kQj6 pic.twitter.com/MX3BK23kJ5
— John D. Johnson (@jdjmke) April 3, 2024
In a lengthy analysis on the Marquette website, Johnson added, “These patterns do somewhat follow Milwaukee’s racial divisions. The ‘Yes’ vote won majority non-Hispanic white wards (53.2% for ‘Yes’) while narrowly losing both majority Black wards (48.4% ‘Yes’) and majority Latino wards (49.4% ‘Yes’).”
Chris Lawrence, statewide outreach director for School Choice Wisconsin, wrote on X, responding to Johnson’s findings, “Regarding the MPS Referendum that narrowly passed: There’s a level of cruelty by a certain demographic of voters in the City of Milwaukee. This demo is largely white, progressive, upper middle income, often childless, has disposable income, but more importantly has a mission to drive out poor Milwaukee citizens out of the city. Largely minorities. They believe in gentrification on steroids.”

Lawrence, who was speaking on his own behalf, not for the organization where he works, continued, “Per this thread by
@jdjmke, this demo voted in large #s for the MPS Referendum. Not caring that a $400-600 yearly rent/property tax increase hurts people who don’t have any disposable income. The higher cost element serves a unique a purpose for this demographic and that is to make it unaffordable for people poorer than them to live in MKE.”
Johnson also found that, on balance, the MPS referendum “won wards with few children and lost wards with lots of children. Yes, you read that right. In wards where… 0-20% of households have kids: 65.8% ‘YES’ 20-40% have kids: 45.9% “YES” 40-60% have kids: 46.9% ‘YES.'”
On balance, the MPS referendum won wards with few children and lost wards with lots of children. Yes, you read that right.
In wards where…
0-20% of households have kids: 65.8% "YES"
20-40% have kids: 45.9% "YES"
40-60% have kids: 46.9% "YES" pic.twitter.com/7K4db4rExH— John D. Johnson (@jdjmke) April 3, 2024
“The referendum received about 41,600 ‘yes’ votes to 39,900 ‘no’ votes. The No’s actually won more wards—172 to 164,” Johnson wrote in his analysis on the referendum.
“As the map…shows, support for the referendum was strongest in neighborhoods along the lake and on the near west side. Opposition was strongest on the far south and southwest sides. Most north and northwest side wards also voted against the referendum,” he added.
The racial angle “differences are small. The presence of children in a ward correlates much more strongly with the referendum vote,” noted Johnson.
“In wards where fewer than 20% of households include a child under 18, the ‘Yes’ vote won by nearly two-thirds of the vote, 65.8%. But in places where more households have kids, it lost. In wards where 20% to 40% of households have a kid, 45.9% of voters supported the referendum. Where 40% to 60% of households have a kid, the ‘Yes’ vote took 46.9%,” he wrote.
“These are just correlations. We don’t have data on how parents themselves voted. But we can say that the MPS referendum was most popular in the parts of the city with the fewest children,” added Johnson.
Read his full analysis of the election here.


![WATCH: Elon Musk Town Hall Rally in Green Bay [FULL Video]](https://www.wisconsinrightnow.com/wp-content/uploads/2022/04/Elon_Musk_3018710552-265x198.jpg)


![The Great American Company [Up Against the Wall]](https://www.wisconsinrightnow.com/wp-content/uploads/2025/03/MixCollage-29-Mar-2025-09-08-PM-4504-265x198.jpg)
![The Wisconsin DOJ’s ‘Unlawful’ Lawman [WRN Voices] josh kaul](https://www.wisconsinrightnow.com/wp-content/uploads/2025/03/MixCollage-29-Mar-2025-08-48-PM-2468-265x198.jpg)