If the liberal justices are serious about “fair maps,” they will pick WILL’s, data analysis shows.
Forget Gov. Tony Evers’ maps. Forget the Republican Legislature’s. If the liberal-controlled Wisconsin Supreme Court is really serious about “fairness” in how legislative districts are drawn, the justices will pick the maps submitted by the Wisconsin Institute for Law & Liberty.
Data generated by the respected Dave’s Redistricting mapping software shows that the legislative maps drawn by WILL are most successful in meeting the various criteria mandated by the state Supreme Court. By far.
On population deviation, competitiveness, and splitting, WILL’s maps squarely outperform Evers’ in fairness (we will define the terms later in this story; just know they are considered important by the court). In compactness, WILL’s and Evers’ maps are similar but WILL’s are better than all of the other maps.
WILL outperforms the other sets of submitted maps in almost all criteria, with the most #1 scores, Dave’s Redistricting’s statistics show. For example, WILL’s maps rank #1 among all maps on splitting and competitiveness. They rank #1 and #2 on population deviation and compactness.
That’s despite the fact that recent rhetoric – in the Legislature and by Evers – has focused on Evers’ maps, which the Legislature passed, but Evers promised to veto because they contained a few tweaks. We decided to analyze all of the maps, comparing them to the criteria actually set by the liberal court.
Remember: These are not our numbers. They are the numbers generated by Dave’s Redistricting program.
In addition to the Evers’ and WILL maps, other maps were submitted by the Republican-controlled Legislature; the petitioners (a liberal law firm); Senate Democrats; and a group of professors.
Dave’s Redistricting generates scores (DRA Rating) for the following criteria: competitiveness, compactness, population deviation, and splitting. We also looked at minority representation because Evers’ previous maps were tossed out by the U.S. Supreme Court when he ran afoul of this consideration. Dave’s Redistricting shows all of the maps are about the same on that front.
We used 2016-2022 composite election data as the underlying data set.
The analysis shows:
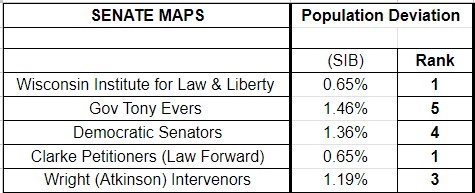
Map Population Deviation
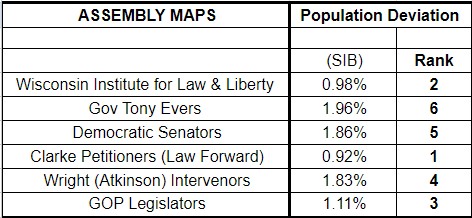
This measures how each map achieved equal populations across districts. It is the range between the most and least populous districts, divided by the ideal district size. Smaller numbers are better.
State Senate:
On population deviation, WILL ties for #1 with Law Forward. Evers is ranked last.

State Assembly:
WILL ranks #2 and Evers #6. The liberal law firm that brought the suit ranked first. Note: There are 6 sets of maps in the Assembly and 5 in the Senate because the GOP Legislature only submitted Assembly maps.

Map Compactness
Compactness requires districts to be as compact as possible. Districts should look reasonable to the eye. Compactness is scored mathematically using three scores Dave’s, Reock, and Polsby-Popper.
State Senate:
There are three ways to measure compactness within Dave’s Redistricting:

WILL ranks #2, 1, and 2.
Evers ranks #1, 4, 1.
Assembly Maps:

WILL ranks #1, 1, and 2.
Evers ranks #2, 3, and 1.
According to the Legislative Reference Bureau, “Compactness represents the principle that districts should be reasonably geographically compact, meaning that the distance between all parts of a district is minimized.”
According to Loyola University, a district “in which people generally live near each other is usually more compact than one in which they do not. Most observers look to measures of a district’s geometric shape.”
Map Competitiveness
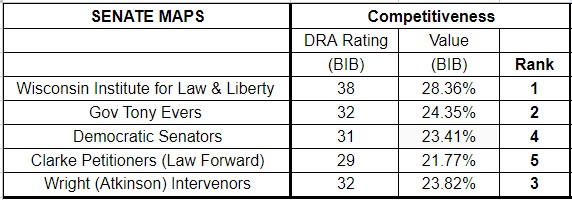
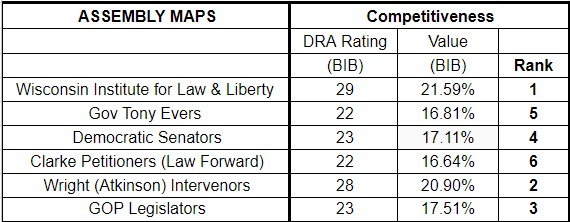
It is believed that competitive districts result in elected officials who listen and respond more to constituents, so it is preferred that maps offer competitive districts. The more (higher number) the better.
State Senate:
On competitiveness, WILL ranks #1. Evers’ map ranks #2.

State Assembly:
WILL ranks #1, and Evers ranks #5.

Map Splitting
Splitting means whether the maps keep municipalities and counties intact so they are not “split” into multiple districts. The less number of cities and counties split, the better.
State Senate:
On splitting, WILL ranks #1, and Evers ranks #2.


There are seven ways to measure splitting. WILL ranks #1 in all.
State Assembly:
WILL ranks #1. Evers ranks #2. Again, WILL ranks #1 on all measurements of splitting.


According to the Legislative Reference Bureau, “In Wisconsin, assembly districts must ‘be bounded by county, precinct, town or ward lines.'” Explains LRB, “Respecting the unity of political subdivisions means drawing district boundaries in such a way as to avoid crossing existing political boundaries. This principle both simplifies the administration of elections and helps to clearly identify for voters the specific district in which they live.”
BIB means bigger numbers are better, SIB means smaller numbers are better.
According to Dave’s Redistricting, in the Evers’ Assembly map, “45 counties are split a total of 146 times: Adams (4), Ashland (1), Bayfield (1), Brown (7), Burnett (1), Calumet (1), Chippewa (4), Columbia (4), Dane (12), Dodge (4), Douglas (1), Dunn (3), Eau Claire (1), Fond du Lac (4),” among others.
The Timeline
The liberal court gave two handpicked out-of-state consultants until Feb. 1 to recommend a set of maps (or draw their own.)
The court will then decide on a set of maps by March 1 and will force candidates in the November elections to run under them.
That’s despite the fact that Article IV of the Wisconsin Constitution reads, “The legislative power shall be vested in a senate and assembly.” However, the governor said he would veto the Legislature’s maps.
The Wisconsin Supreme Court’s Redistricting Requirements
What does the liberal court list as the key criteria in its decision? From the court’s own words:
1. “The remedial maps must comply with population equality requirements.” That’s measured by population deviation. “Federal law require a state’s population to be distributed equally amongst legislative districts with only minor deviations,” the court wrote.
2. “Assembly districts must be (a) bounded by county, precinct, town or ward lines; (b) composed of contiguous territory; and (c) in as compact form as practicable.” This is measured by compactness, in part.
3. “Maps must comply with the Equal Protection Clause and the Voting Rights Act of 1965.” (that’s the race question we mentioned above.)
4. “Reducing municipal splits and preserving communities of interest.” This is measured by “splitting.”
5. “We will consider partisan impact when evaluating remedial maps.”
Although the court said the maps should be assessed based on “partisan impact,” as noted above, the court’s decision does not provide any metric for how the court wants this measured.
The court decision also contains contradictory and confusing language about partisan impact, saying things like,
“as a politically neutral and independent institution, we will take care to avoid selecting remedial maps designed to advantage one political party over another. Importantly, however, it is not possible to remain neutral and independent by failing to consider partisan impact entirely.”
According to a redistricting primer published by Loyola University, the U.S. Supreme Court has “unanimously stated that excessive partisanship in the process is unconstitutional, but the Court has also said that federal courts cannot hear claims of undue partisanship because of an inability to decide how much is ‘too much.’”
This may be the hole the liberal court plans to drive a Mack truck through to game the maps for Democrats. However, again, if they do so, they will be ignoring the fact that WILL’s maps are superior.
How We Got to This Point
A short time ago, the liberals on the state Supreme Court declared the Legislature’s maps unconstitutional because they were not “contiguous” – meaning they contained “municipal islands.”
Those are just little pieces of land, often without people on them, annexed by municipalities. The Legislature’s maps kept those little islands with the municipalities that annexed them because the state Constitution also requires that communities of interest and municipal boundaries be preserved.
According to Loyola University, “boundaries like this are fairly common by-products of annexation.”
Dave’s Redistricting Maps record a number of non-contiguous districts in multiple maps, but we did not consider that data because of the complexity of analyzing non-contiguity in a stipulation among the parties that relates to counting census blocks. Marquette research fellow John Johnson’s blog says all of the maps meet the contiguity test.
The U.S. Supreme Court tossed Evers’ previous maps on the basis of race. The state Supreme Court then picked the Legislature’s maps.
Gov. Evers and the liberals on the court were fine with municipal islands when Evers submitted his maps in the past, and the court chose them after the 2020 census. They have not explained what changed, other than liberals seizing control of the court upon the election of a justice who took $10 million from the state Democratic Party and campaigned against the maps, calling them “rigged.”
The court, with the liberals now in charge, then fast-tracked a new lawsuit on the maps, tossing out the Legislature’s maps, and here we are.
Table of Contents


![WATCH: Elon Musk Town Hall Rally in Green Bay [FULL Video]](https://www.wisconsinrightnow.com/wp-content/uploads/2022/04/Elon_Musk_3018710552-356x220.jpg)


![The Wisconsin DOJ’s ‘Unlawful’ Lawman [WRN Voices] josh kaul](https://www.wisconsinrightnow.com/wp-content/uploads/2025/03/MixCollage-29-Mar-2025-08-48-PM-2468-356x220.jpg)


![Phil Gramm’s Letter to Wall Street Journal [Up Against the Wall]](https://www.wisconsinrightnow.com/wp-content/uploads/2025/03/gramm-356x220.png)


